
Socio-Economic Research > Demographics > Demographic Transition and Economic Growth
The Factor People for Economic Growth
Are the years of strong sustainable economic growth a thing of the past?
Posted July 15, 2021
Key Takeaways
- After population growth reached an unprecedented speed in the 1960/70s it has since significantly slowed down and predictions from the UN indicate that this trend will likely continue.
- Growth of the working age population can be seen as natural driver of economic growth if more people are able to produce more goods and provide more services.
- As more countries experience the challenges that the demographic transition poses to their economies, swift policy action is required to engage all groups of the working age population.
2020 has been a challenging year for many countries, businesses and individuals as they faced strict lockdowns and saw the economy stumble as whole industries were facing a ‘perfect storm’. There exists a limited number of historical comparisons for when a pandemic had such an altering effect on economic performances, and it is almost impossible to account for or predict such far-reaching developments. Sudden and unprecedented events and short-term effects that can send an economy into a slump are hard to predict in any economic outlook and are the exception to the rule.
Economic growth is, quite contrary to the events in 2020, often a process that is determined by long-term trends and decisions that affect its dynamic many years later. Covid-19 has had an effect on countries across the globe and with an international network of trade flows and social relationships, it is more likely today than before that there are factors that have a global effect on economic growth. However, there remain differences across countries regarding the significance of those effects and other variables that determine varying economic developments between every individual country. To identify those specific variables that can explain cross-country differences on economic growth has been the goal of many economists. One of the most influential books in this field by Acemoglu determines three central factors that correlate with economic growth: investment in human capital, investment in physical capital and differences in technology. However, he emphasizes that focusing solely on those three factors would not be enough because it does not explain why countries simply invest more or improve their technologies if they are so important for economic growth. That is why he points to more fundamental causes that help understand the differences in technology and investment and, thus, the cross-country differences in economic growth. In brief, he differentiates between luck that countries take on different paths, their geographic location, differences in institutions and policies and cultural differences. A quick assessment shows that, even though all of them are theoretical valid reasons, especially differences in institutions and policies seem to drive cross-country differences.[1]
This short summary shows the variety of factors that can drive economic growth and it would exceed the scope of this article to analyze all of them. The aim of this article is to focus closer on one key driver that is positioned somewhere in the realm between the four fundamental causes of economic growth and how they affect investments and technology. The growth of the total population and especially the working age population (WAP) has been a widely studied influencing factor of economic growth. Similar to Acemoglu’s initial approach, this article does not intend to establish a significant causal relationship between population size and economic growth but to study and raise attention of the broader relationship between the two variables. At the end, the analysis should enable us to make a statement about the future outlook of economic growth based on trends in population growth.

This article uses current data from the World Development Indicators database published by the World Bank with an observation period from 1965 to 2019 and a sample size of up to 217 countries and territories (depending on the year of observation).[2] Creating a figure that includes the relevant indicators and the observations from all countries over an extended period of time (panel data) is quite complex and might not immediately unveil an existing relationship.
Chart 1
shows a scatter plot with all observations for economies that grew by more than 5 percent in a given year with WAP and economic growth on the x- and y-axis, respectively. Considering the size of the data set there are a lot of countries that saw their economies grow by 5 percent or more in a given year, which makes a first assessment of the relationship difficult. Some of the outliers are labeled to facilitate a better understanding of the data set structure. As a first measure to make the data more manageable, the observations are marked by color to show the decade of the observation. Additionally, a trend line for each decade helps to visualize the relationship between economic growth and WAP growth for the given period. The first insight that can be gained from this graph is that, overall, there seems to be a positive relationship but that the
effect is decreasing over time. Whereas an increase of the WAP by 1 percent in the 1970s resulted in a 1.1 percentage point increase of a country’s economic output it dropped to only 0.1 percentage points for observations in the decade 2010-19. One limitation regarding the decreasing positive effect over time is that data availability for earlier records was not as comprehensive as today and that economic data is missing especially for some developing countries. In the process of the data preparation this effect was accounted for, but it is possible that some growth rates are higher based on missing observations from the year(s) before or that WAP growth rates did not have a matching GDP growth rate at all.
Trends in population and economic growth
To get a better understanding of the initial dynamic identified in chart 1 it is helpful to take a step back and look at trends of economic growth and population growth separately. In
chart 2, population growth is displayed and based on previous considerations divided into three age groups that allow to separate the WAP from younger and older age cohorts. The first obvious finding is that the global population has consistently grown over time and is today approaching the 8 billion mark. When population growth reached a new record annual rate of more than 2 percent in the middle of the last century, scientists of the National Academy of Sciences (NAS) sounded the alarm that accelerating population growth, particularly in developing countries, could impair economic development and the improvement of human welfare.[3] However, starting with an NAS report from 1986, this perspective has substantially shifted as slower population growth became the dominating object of research combined with the realization that many concerns expressed before were unfounded.[4] Over the past 20 years or so, the term demographic transition has been used in the

academic literature to discuss trends that focus on significantly lower population growth rates.
The cause of this shift in thinking among scientists and economists can be best explained by looking at the growth rates of the different age cohorts presented in the lower half of chart 2. The red line presents yearly global population growth and has almost a linear character with a negative slope. Whereas the global population grew by more than 2 percent each year around 1970, this rate has continuously slowed down to a growth rate of merely 1 percent in 2019. Demographic transition is characterized by a decreasing population growth rate caused by an initial drop of mortality rates that is followed by a decreasing fertility rate.[5] And the data presented here only showcases the end of this development. Western European countries saw their fertility rates falling as early as in the 1870s, with other developed countries following soon after, reaching developing countries in the second half of the 20th century.[6]
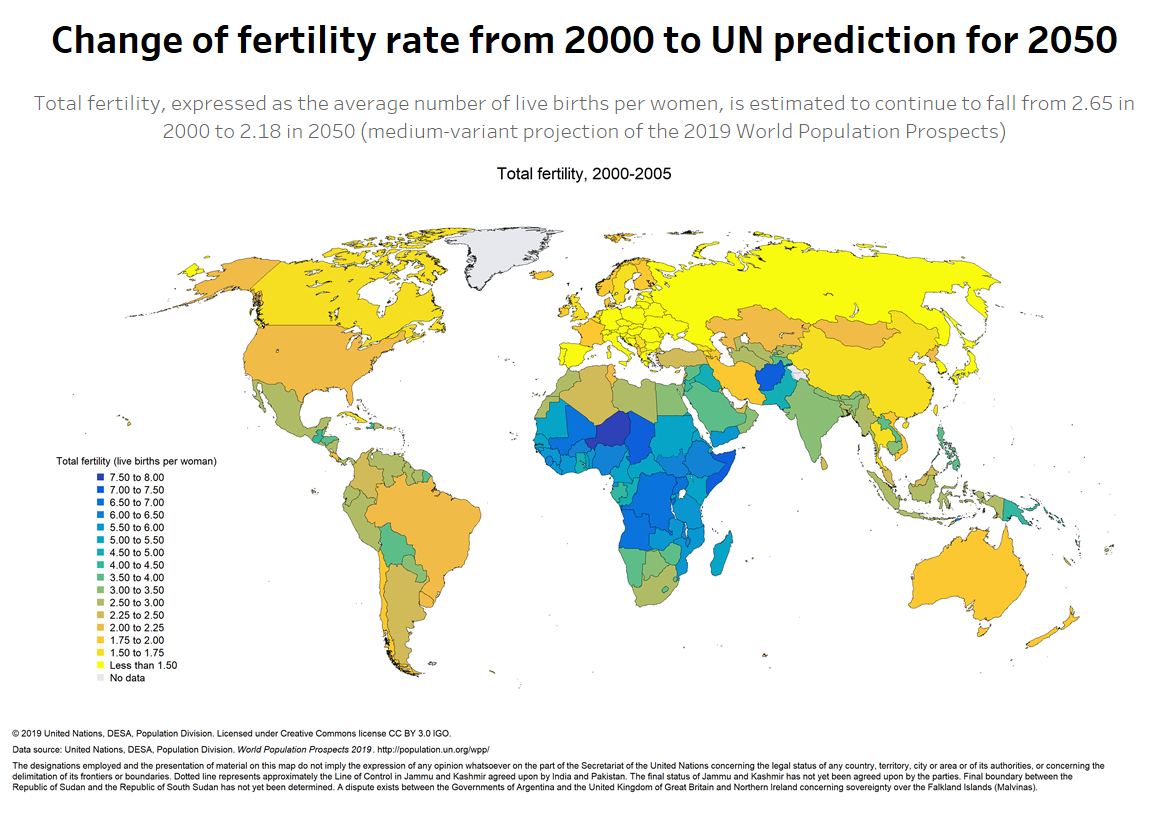
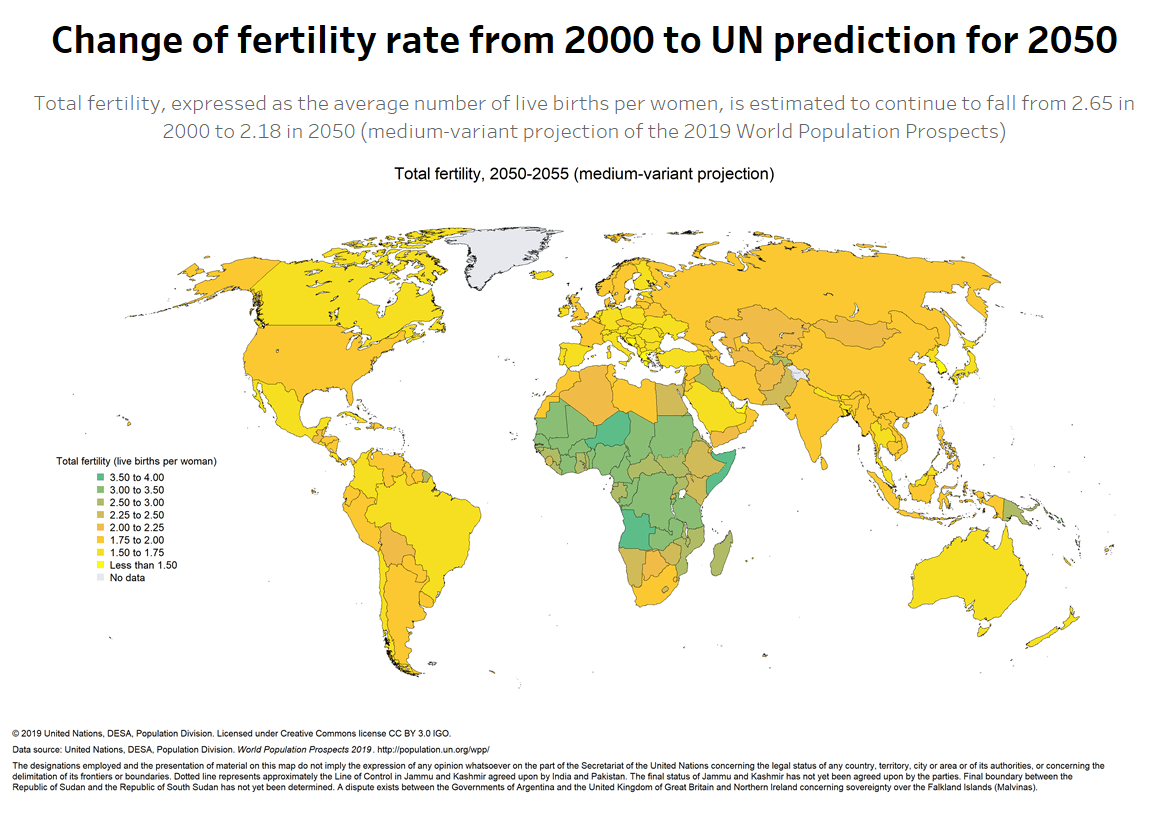
Chart 3 shows that in 2000, all European countries registered a total fertility rate below 2, which is lower than the reproduction rate considered necessary to keep the population size at least stable over time (2.1). And even though many countries in Africa saw high fertility rates in 2000, the medium-variant projection by the UN Population Division estimates that there will not be a single country left in the world with a higher rate than 4 by 2050.[7]
As a result of the dramatic drop in the global fertility rate, younger age cohorts that are slowly moving into the WAP are contributing less to population growth than in the past. The line for the age group 0-14 in the lower half of chart 2 shows that in the early 2000s growth was actually negative, thus the population aging 0-14 was decreasing over a couple of years. Simultaneously, the group of people 65 years and older is benefiting from higher life expectancy and has seen a significant increase of their growth rate over the last decade, marking 3.8 percent in 2017 and 2018. Thus, it is likely that the key driver of the demographic transition (fertility rate and mortality) are complemented by a third effect, which is the longer life expectancy that results in a growing age cohort of adults older than 65 who will represent an increasing share of the total population.
Leading research in the area of demographic transition and economic growth has been done by Harvard economist and demographer David Bloom. He and his colleagues evaluate the potential effects of an ageing population and demographic transition on economic growth.[8] They outline various positive and negative effects and demonstrate that the overall outcome is not as definite as described in some models. The highest uncertainty related to the demographic transition process is the behavioral change of the different age cohorts. The potential growth of economic output will especially depend on the behavioral changes of the older age groups. In a life-cycle model, each individual will consume or produce more as they grow older. The assumption is that kids and retirees consume more and adults in a working age produce more. Now, “if age-specific behaviour with respect to labour supply and savings were fixed, labour supply and savings per capita would tend to decline with a rising elderly share of the population[9]”. This would imply a negative effect of the demographic transition on economic growth. But this transition is also likely going to have an effect on norms and individual behavior where a longer life expectancy and better health will motivate many people to work longer or increase their savings to guarantee the same life standard after retirement. But behavioral change will not be enough to compensate for a higher retiree to WAP ratio. Bloom et al. say that behavioral change has to be initiated or at least supported by swift policy measures and an active participation of businesses. Continuous support of economic growth by a diminishing WAP ratio to total population will depend on the promotion of labor force participation and increase of productivity of the labor force itself.

Before linking the economic growth data to the previously discussed dynamics of population growth, Chart 4 outlines the share of regions on the global economy and how the distribution changed over time. Three broader trends can be derived from the upper half of the chart. First, the share of the economies of the Middle East, Oceania, Latin America and Africa have been fairly stable over the last 30 years, fluctuating by less than two percentage points. Second, the share of Europe’s as well as the United States’ and Canada’s economies have decreased by 14 and 5 percentage points, especially in the case of Europe a significant reduction of their global share. Third, and one of the reasons of second, Asia’s economies have experienced a period of strong economic growth that have propelled their region’s share of the global economy from 21 percent in 1990 to 39 percent in 2019. The yearly avg. growth rates in the lower half of the chart emphasize these trends. Focusing on four regions to facilitate a better view, Asia outpaces the rest of the world especially since the early 2000s. Other regions experience more fluctuating economic growth rates that have stabilized to some degree after the financial crisis between the range of 0 to 3 percent. Especially for Latin America, home to promising emerging markets in the early
2000s, this development is quite concerning considering the low base level.
Determining the immediate effect of WAP growth on economic growth
After discussing developments in economic growth and population & WAP growth separately, the following will bring both indicators together and assess the influence of WAP growth on economic growth. An analysis that served as inspiration for this article was written by Ruchir Sharma, who is the Head of Emerging Markets and Chief Global Strategist at Morgan Stanley, and an advocate of an immediate link between the two indicators.[1] In his analysis of the global economic development after the Great Recession he identifies the slow growth of the labour force as one of the key factors why economic growth has not been able to reach previous levels. With labor force and technology as key variables in his equation of economic growth, the measurable growth rate of the labor force enables him to define a baseline rate at which he would expect the economy to grow. Starting in the 1990s, the demographics in many countries started shifting as a result of long-term trends such as improved health care and decreasing fertility rates. Based on historical data, Sharma estimates that it needs an annual 2 percent WAP growth rate to facilitate a decade-long economic boom. Because many countries, and especially developed countries, are far away from such growth rates or even see their labor force decline, he says it is likely that the trend of slow economic growth will continue unless swift policy action, as suggested by Bloom et al., is embraced.
The results presented in chart 5 support Sharma’s findings, showing that economies with an average WAP growth rate of more than 2 percent experienced stronger economic growth over the same period compared to countries with a slower growing or shrinking WAP. The method used in the chart is relatively simple as it defines fixed 5 year periods that do not account for growth periods in between those periods. However, the findings show that economies with an average yearly WAP growth of more than 2 percent grew by approximately 1 to 2 percentage points faster than those with a smaller WAP growth. At the same time, the growth gap between the economies that saw their WAP grew on average by 2 and 3 percent is significantly smaller, strengthening Sharma’s hypothesis that the 2 percent yearly WAP growth rate is a good benchmark to determine a country’s prospects of sustainable economic growth.
Additionally, the bars in the chart display the number of countries that experienced a 5 year period with an average WAP growth of 2 or more percent (the group of countries with an average WAP growth of 3 or more percent is included in the

count of the previous group). Until the early 2000s, the number of countries and territories with an average growth rate of equal to or more than 2 percent over a 5 year period were stable above 100. However, over the last 20 years, this number has almost halved, an indicator that the demographic transition has reached developing countries in Africa and Asia. There have been 67 countries and territories across the globe that saw their WAP grow on average by more than 2 percent per year over the last decade. A closer look at the list of countries unveils that the largest economies comprise emerging markets like Saudi Arabia, Nigeria, Pakistan, and the Philippines as well as other rising economies in Africa. However, the economic output of all 67 countries and territories together was only responsible for 7 percent of global GDP in 2019 (measured in constant 2017 international dollars). Even if there were economic miracles to happen in any of those countries in the future, the sizes of their economies are too small to have a lasting effect on global economic growth trends.
Because chart 5 has its methodological restrictions, the figures of selected countries in chart 6 provide a perspective from a lower level of aggregation and show the country-specific relationship between WAP and economic growth. The graphs are divided up into three groups of countries that are divided by their economic development. In the lower row are the United States, Japan and Germany as representatives of developed countries followed by Brazil, China and India in the middle row as large emerging economies and in the top row Nigeria, Pakistan and the Philippines representing developing countries with an average WAP growth rate above 2 percent. Studying all nine graphs it is not possible to detect an obvious positive relationship between economic growth and WAP growth, but a rather mixed picture across the stages of economic development.
However, there are some interesting observations that should be highlighted. First, the selected developed countries have seen a very slow average WAP growth, and their economies were simultaneously growing at a low rate. An observation that supports previous arguments. But the dynamics are different and less clear for countries with a higher average WAP growth

rate. Brazil’s WAP growth rate has been constantly falling but their economic performance also collapsed, which can be connected to the deterioration of institutions, the lack of investment in its infrastructure and the dependency on commodities and their price fluctuations. China, on the other hand, has seen a remarkable development and growth of its economy over the last decades. Its high and persistent economic growth rate was long supported by the largest population in the world that could supply enough labour to the labour intensive manufacturing and textile industries. However, these favorable conditions have changed, and China is today facing a shrinking WAP. China could still experience an extended period of strong economic growth because there remains a significant share of the population that would benefit from investments in human capital.
For other countries in the chart, the correlation between economic growth and WAP growth is just as ambiguous. In the case of India and the Philippines the trend actually tends towards a negative relationship between WAP growth and economic growth. As the WAP grows slower economic growth seems to pick up. This is an indication for other factors playing a significant role for economic growth that at least need to be fulfilled before a growing WAP can contribute to economic growth. Thinking back to Acemoglu’s argument those indicators are likely the fundamental causes of economic growth that were outlined before. Especially institutions and policies that support an active participation in the labor force, flexible working models for families and investment securities for businesses are essential for developing countries as well as developed countries to take advantage of the rest of WAP growth that is left and enable stronger periods of economic growth.
As emphasized at the beginning of this article, there are countless other factors that influence economic growth and will play a more or less significant role every other year. At this time, we only want to touch upon two aspects that are immediately related to our considerations. Even though this article focused on population growth and growth of the working age population, there are other closely related variables that could play an equally important role for economic growth. For example, not everyone in the WAP will actually participate in the labor market due to a variety of reasons, which makes the labor force participation rate an important indicator to consider. The decision to focus on population growth instead was made based on the assumption that population size represents all people that could potentially contribute to economic growth. Policies that promote women labor force participation and encourage employees to work beyond the age of 65 will become increasingly important for countries that face a stagnating or shrinking WAP.
Outlook
Economic growth is driven by many different factors and monthly or even yearly growth rates can be affected by short-term effects such as the Covid-19 pandemic. However, over the long run, economists have defined well-reasoned frameworks that help explain cross-country differences of economic growth. This article focused on one particular variable of those frameworks by analyzing the link between growth of the working age population and economic growth. The results of the analysis were mixed but overall showed a positive effect of WAP growth on economic growth. Countries that have seen strong WAP growth over a longer period of time often experienced higher economic growth rates over that same period. Simultaneously, developed countries that are already further down the road in their demographic transition could not reach previous levels of economic growth. The findings support the hypothesis that WAP growth increases the chance for strong economic growth if other conditions not studied in this article create a favorable framework. Considering slower population growth today it should be expected that future periods of strong economic growth will occur less often and if they do, countries will need to overcome a slower growing or even shrinking WAP.
This article can also be found under:
Footnotes
[1] Acemoglu, Daron. 2009. “Introduction to Modern Economic Growth.” Princeton, NJ: Princeton University Press.
[2] World Bank. 2021. “Data Bank: World Development Indicators.” https://databank.worldbank.org/source/world-development-indicators#.
[3] National Academic of Sciences. 1963. “The Growth of World Population: Analysis of the Problems and Recommendations for Research and Training.” Washington, DC: The National Academies Press. https://doi.org/10.17226/9543.
[4] National Research Council. 1986. “Population Growth and Economic Development: Policy Questions.“ Washington, DC: The National Academies Press. https://doi.org/10.17226/620.
[5] Cervellati, Matteo and Sunde, Uwe (2009). “Life Expectancy and Economic Growth: The Role of the Demographic Transition.” Institute of Labor Economics Discussion Papers, No. 4160.
[6] Galor, Oded (2005). “The demographic transition and the emergence of sustained economic growth.” Journal of the European Economic Association. No. 3 (2): pp. 494-504.
[7] UN Population Division (2019). “2019 Revision of World Population Prospects.” https://population.un.org/wpp/.
[8] Bloom, David E., Canning, David, and Fink, Günther. 2010. “Implications of population ageing for economic growth.” Oxford Review of Economic Policy. Vol. 26 (4): pp. 583-612.
[9] Bloom et al., 2010, p. 594.
[10] Sharma, Ruchir. 2016. “The Demographics of Stagnation: Why People Matter for Economic Growth.” Foreign Affairs. Vol. 95 (2): pp. 18-24.
Sharma, Ruchir. 2016. “The Rise and Fall of Nations: Forces of Change in the Post-Crisis World.” New York, NY: Norton.